Prof. Dr Robert Ramakrishnan
Extension of the Jominy test to include a temperature measurement system using optical sensors
Motivation
Understanding the relationship between thermal process control (heat treatment) and changes in material properties is at the heart of the modules on metallurgy and non-cutting manufacturing. The non-cutting manufacturing internship builds on this, enabling students to heat-treat and characterise materials themselves. Until now, however, it has not been possible to measure thermal process control with precision. This project has taken on this challenge.
Effect
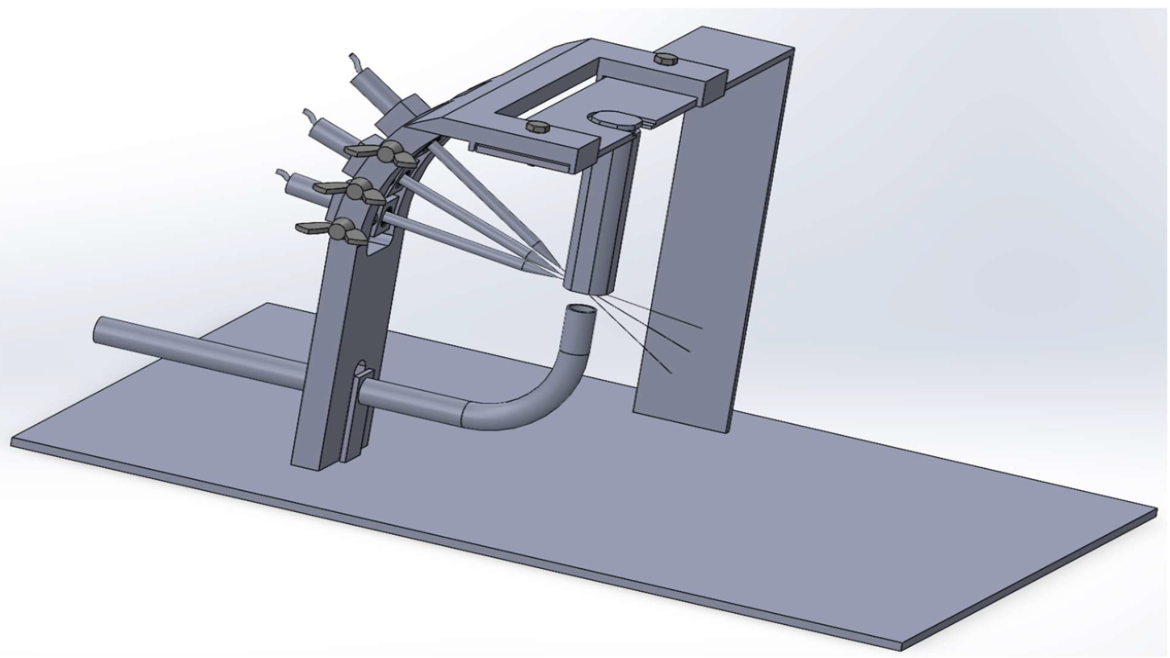
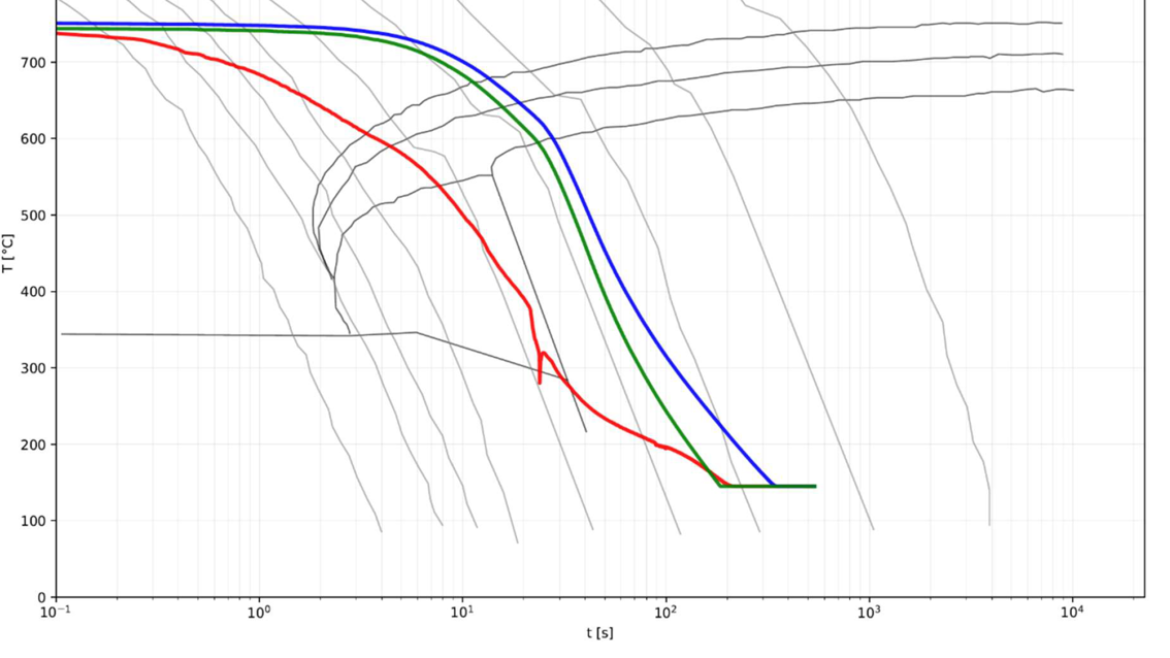
"The measuring device developed enables high-frequency temperature measurement on the surface of specimens during the so-called Jominy test (a standard test for determining the hardenability of steels). This measuring device is used to record the precise temperature distribution along the specimen, enabling students to understand the theoretical relationship of the time-temperature transformation diagram in practice. The additional setup makes it possible to better understand the relationship between temperature and hardness distribution at various points on the specimen."
- Prof. Dr Robert Ramakrishnan
| Module information | |
|---|---|
| Funding period | Winter semester 25/26 |
| department | Department 03 |
| Degree programme | MBB / FMB / LRB |
| Module title | Materials Engineering & Non-Cutting Manufacturing |
| Module responsibility | Prof. Matthias Reihle |
| Learning outcomes achieved | Students can … |
| ... explain the relationship between temperature control during cooling and the distribution of hardness in steel | |
| ... analyse the recorded data and incorporate it into the ZTU diagrams for the relevant steels | |
| ... apply the findings to other metallic materials |
Further links
Find out more about the Materials Engineering Laboratory at Department 03.
Interested? Why not apply for funding for your teaching innovation too!
Contact
Center for Innovation in Teaching and Education